Little Earth / Field Notes / Creating a Terrain Wetness Index from a DEM
GIS & Terrain Analysis
Creating a Terrain Wetness Index from a DEM
Deriving a topographic wetness index from a digital elevation model in GRASS GIS by combining mean elevation variance with aspect variance.
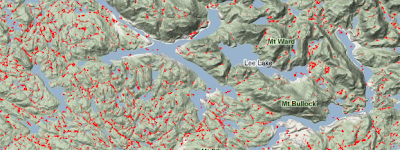
Areas identified as high value within the Terrain Wetness Index. Located in mainland British Columbia, east of the northern tip of Vancouver Island.
From the archive
This post was originally published in April 2011 on my old "Mostly a GIS Guy" blog. It has been preserved here, lightly edited, as part of the blog migration to Little Earth.
A Terrain Wetness Index (TWI) is a means for measuring drainage in a landscape — in particular, areas with poor drainage. The purpose is to isolate dips and hollows that maintain water for longer periods, exclusive of permanent water bodies like lakes and swamps.
A Digital Elevation Model (DEM) was acquired at 25 metre resolution. It was in an older ESRI grid format and separated into tiles.
I'm too cheap to buy ArcInfo… so I use GRASS. First job is to import the grids:
r.in.gdal input=tdem092k.asc output=tdem092k
r.in.gdal input=tdem092l.asc output=tdem092l
...
Next is to merge them together:
r.series input=tdem092k,tdem092l,tdem092m,tdem092n,tdem093c,tdem093d,tdem093e,tdem093f,tdem102i,tdem102p,tdem103a,tdem103h output=dem method=averageNow we have a seamless dataset to work with called dem. Time to do the real work.
Elevation Variance
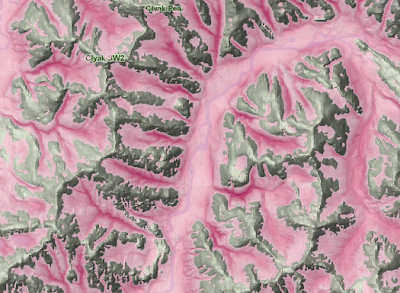
Areas of high negative elevation variance.
The simplest way to calculate TWI is to run an elevation variance algorithm on the DEM. Simply put, this is a neighbour function that looks at the average elevation of all surrounding cells, then calculates variance based on itself and the average.
To do this, two separate commands were required. The first calculated mean elevation for each cell:
r.neighbors -c input=dem output=mean3 size=3This produced a dataset (mean3) holding the mean elevation for a window of 3×3. Considering the cells are 25 metres, this resulted in a 75 by 75 metre window. The r.neighbors command defaults to mean as the function, so it isn't necessary to specify it on the command line.
The second step is to calculate variance by comparing each elevation value in the original DEM with the new mean values. GRASS's extremely powerful and versatile r.mapcalc command is used for this.
r.mapcalc mean3diff = dem - mean3We are looking for the dips only, not the peaks. Peaks have positive values whereas dips have negative values. So we need to select for the negative variance values:
r.mapcalc mean3dip = "if(mean3diff < 0, mean3diff, 0)"These steps were repeated for different sized windows — 7 and 15. Then the three were added up:
r.series input=mean3dip,mean7dip,mean15dip output=dips method=sumThe result is illustrated above.
You may have noticed the image clearly identifies steep river valleys. This isn't exactly what we are after. We want to find low-lying areas of poor drainage. We got low-lying areas of high drainage.
Calculating mean elevation variance alone results in something like the following:
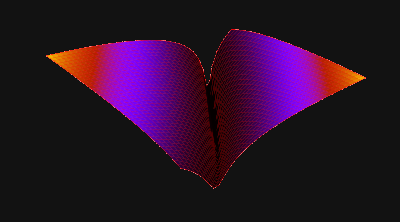
Terrain shape isolated by Mean Elevation Variance.
We are after a closed shape. Kind of like this:
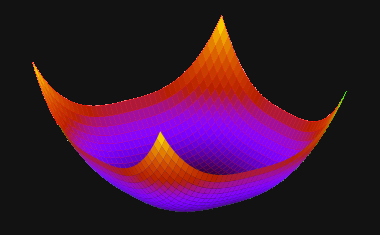
A closed dip resulting from the combination of Mean Elevation Variance and Mean Aspect Variance.
To achieve this we need to add another variable: aspect variance.
Aspect Variance
Aspect is a term for terrain direction, or the direction in which a slope is facing. If we apply the process above to aspect, we can expect to isolate areas of high aspect variance.
Generate an aspect layer from the DEM with the r.slope.aspect command:
r.slope.aspect elevation=dem aspect=aspectThis creates a layer called aspect which contains continuous, floating point values of aspect in degrees. It is hard to correctly measure variance with continuous data. So the next step is to cluster the values into four classes — North, South, East, and West (identified numerically as 1–4). Mapcalc takes care of that:
r.mapcalc aspect_rc = "if(aspect > 45 && aspect <= 135, 1) + if(aspect > 135 && aspect <= 225, 2) + if(aspect > 225 && aspect <= 315, 3) + if(aspect <= 45 && aspect > 0, 4) + if(aspect > 315 && aspect <= 360, 4) + if(aspect == 0, null())"Now we can run the variance procedure:
r.neighbors -c input=aspect_rc output=variance3aspect size=3 \
method=variance
r.neighbors -c input=aspect_rc output=variance7aspect size=7 \
method=variance
r.neighbors -c input=aspect_rc output=variance15aspect size=15 \
method=variance
r.series input=variance3aspect,variance7aspect,variance15aspect \
output=aspects_3_15 method=sum
Creating the Final Terrain Wetness Index
After reviewing both datasets, aspects_3_15 and dips, it was determined to select areas based on the following:
- Aspect variance greater than or equal to 10
- Mean elevation variance less than -10
Another mapcalc statement takes care of this:
r.mapcalc twi = "if(aspects_3_15 >= 10 && dips < -10, dips, null())"When the criteria are met, the resulting cells are populated with elevation variance. This allows for a gradient of depth for dips and hollows. All cells not selected are populated with null values.
The result is our final Topographic Wetness Index and looks like this:
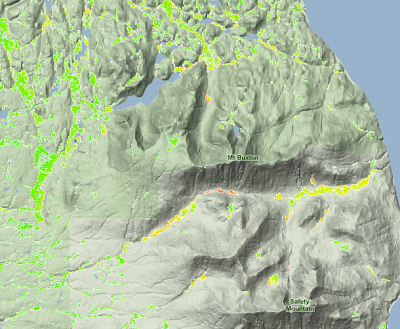
Final Topographic Wetness Index model.
This has proven to be a valuable input to a model I am currently working on. If you want to see it in action, take a look at the Yellow Cedar Decline Mashup.
— Jamie