Little Earth / Field Notes / Skywatch
Spatial R&D
Skywatch: real-time 3D viewshed analysis in the browser
An R&D project on a question I keep running into: what can you actually see from a point on the land — and can we compute that fast enough to explore it live, in 3D, in a web page?
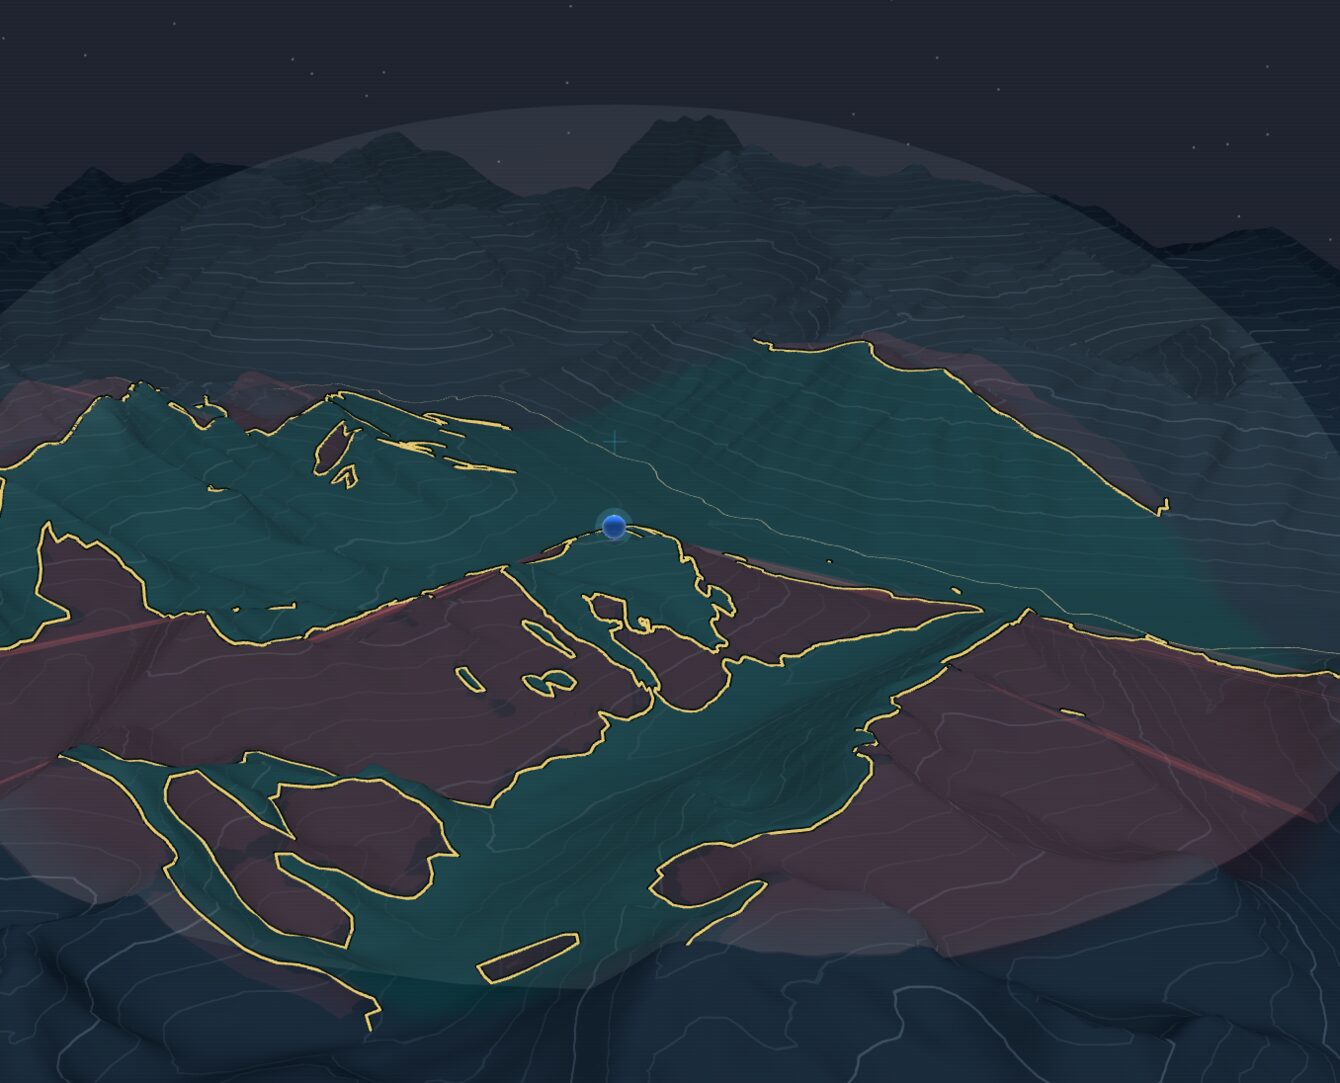
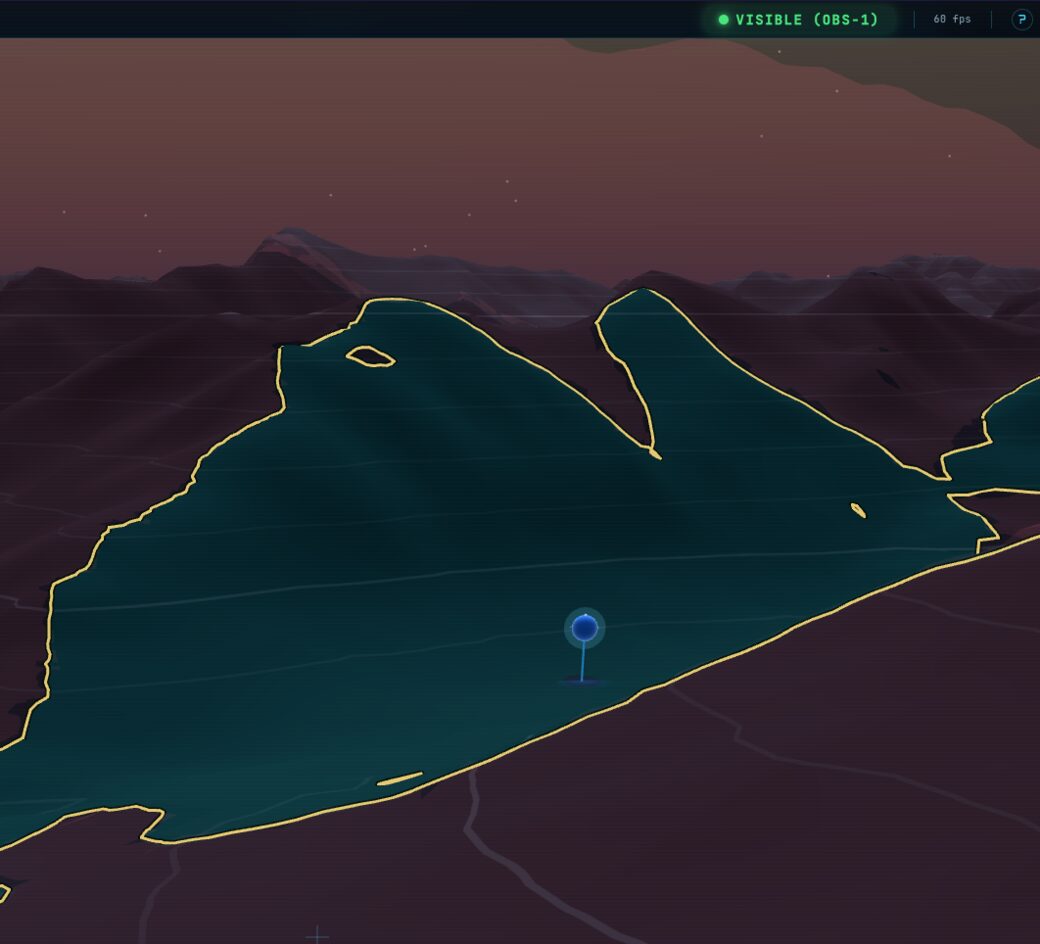
A computed viewshed in Skywatch’s default view. The terrain itself is painted — teal where the observer (blue marker) can see, maroon where intervening ridges cut off the view — with an amber line tracing the exact boundary and a translucent dome marking the analysis radius.
A viewshed answers a deceptively simple question: standing at a particular spot, what parts of the surrounding landscape can you actually see, and what is hidden behind hills and ridges? It's a classic piece of GIS — useful for siting a lookout or a communications tower, checking the sight lines from a trail or a new building, modelling how far a signal or a sound carries, or just understanding the shape of a valley.
The classic version has two limitations that have always bugged me. First, it's usually offline: you set up an analysis, wait, and look at the result afterwards. Second, it's usually flat — a 2D polygon draped on a map, which throws away exactly the vertical information that makes terrain interesting. Skywatch is my R&D answer to both: a tool that computes viewsheds as real three-dimensional volumes, fast enough to drag an observer around and watch the visible region re-form in real time — all running in a plain web browser.
What this is
Skywatch is an internal Little Earth research project — a place to push on high-performance spatial computing on the open web. This write-up focuses on the engineering. Everything below runs client-side: there is no server doing the heavy lifting.
Start with the terrain
Everything begins with a digital elevation model — a grid of ground heights. Skywatch streams that terrain into the browser as terrain-RGB tiles (elevation packed into the colour channels of ordinary PNGs), loads only the tiles in view, and caches them in the browser's IndexedDB so a return visit is warm in a fraction of a second. The default scene is a stretch of the Coast Mountains around Whistler and Pemberton, British Columbia — dramatic relief that makes for an honest stress test.
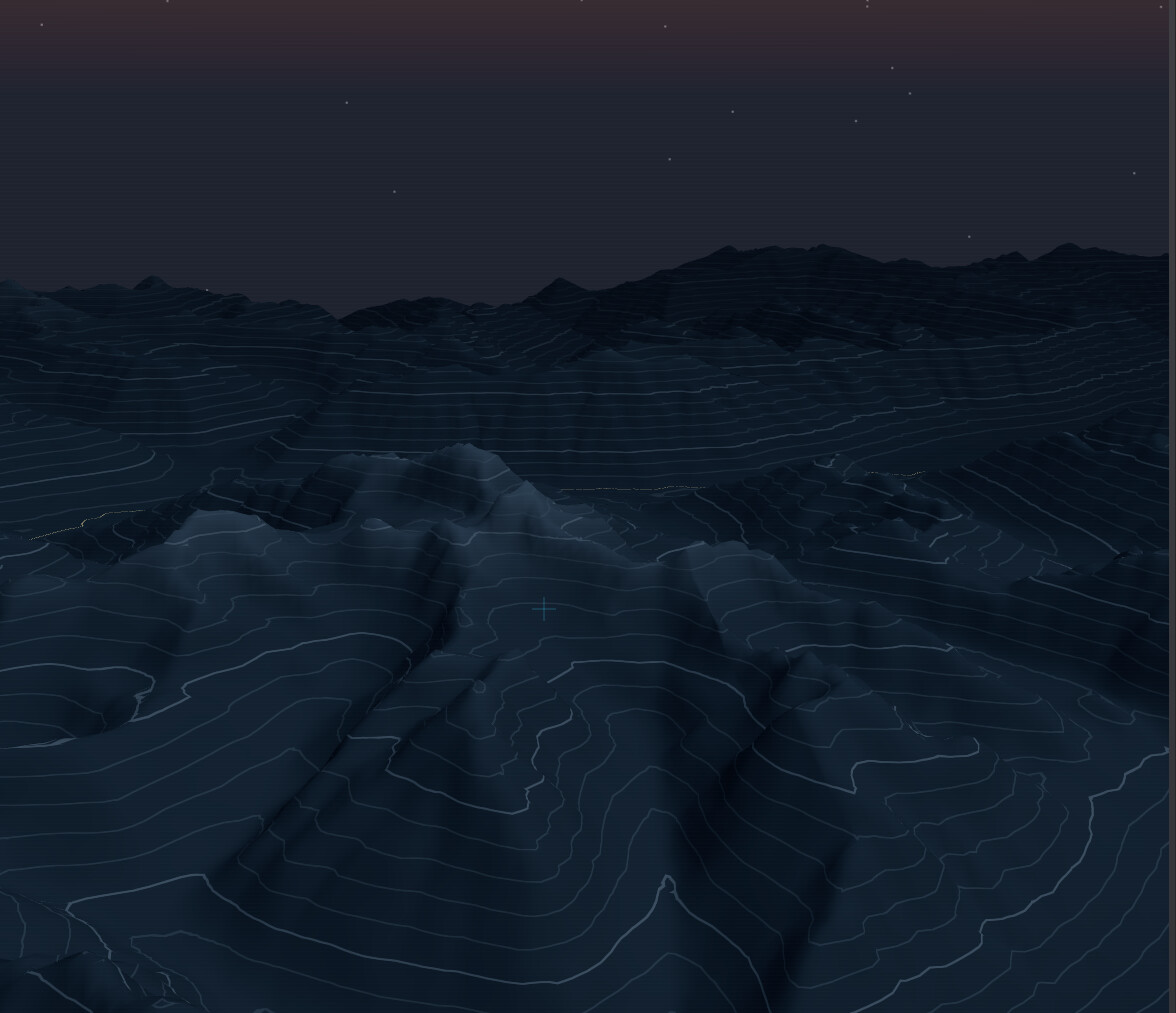
The starting point: a bare elevation surface — contour lines and all — streamed into the browser as terrain tiles, before any analysis.
Drop an observer, hit Calc
You place an observer with a glowing, draggable marker. While you drag, a fast preview repaints visible and hidden ground in real time using the GPU's own shadow machinery — instant, approximate feedback. When you want the precise answer, you hit Calc: a quick expanding ring sweeps out to the chosen radius, the real solver fires, and a moment later the exact result paints itself across the terrain — teal where the observer can see, maroon where it can't, edged by a crisp amber boundary line. A right-hand console carries each observer's settings — radius, eye height, sampling resolution — and a birds-eye radar scope in the sidebar plots your observers and where the camera is looking. You fly the camera with mouse and keyboard — or, if you have one plugged in, a 3D mouse for full six-degrees-of-freedom flight.
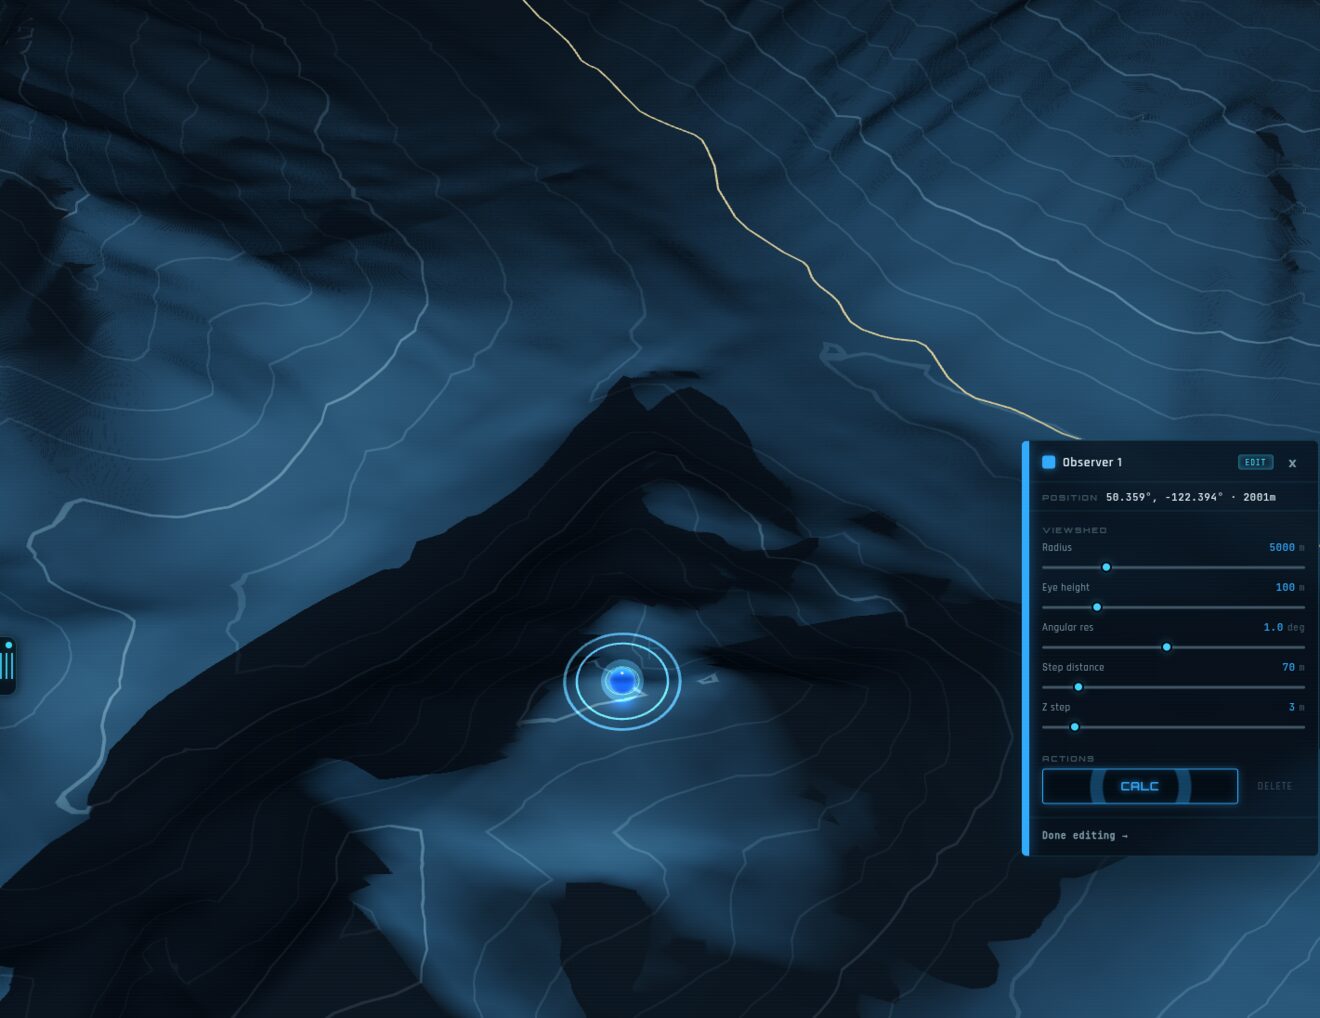
Placing an observer. Drag the glowing marker across the terrain and a live GPU preview paints what it can see; the console on the right holds that observer’s settings and the big CALC button.
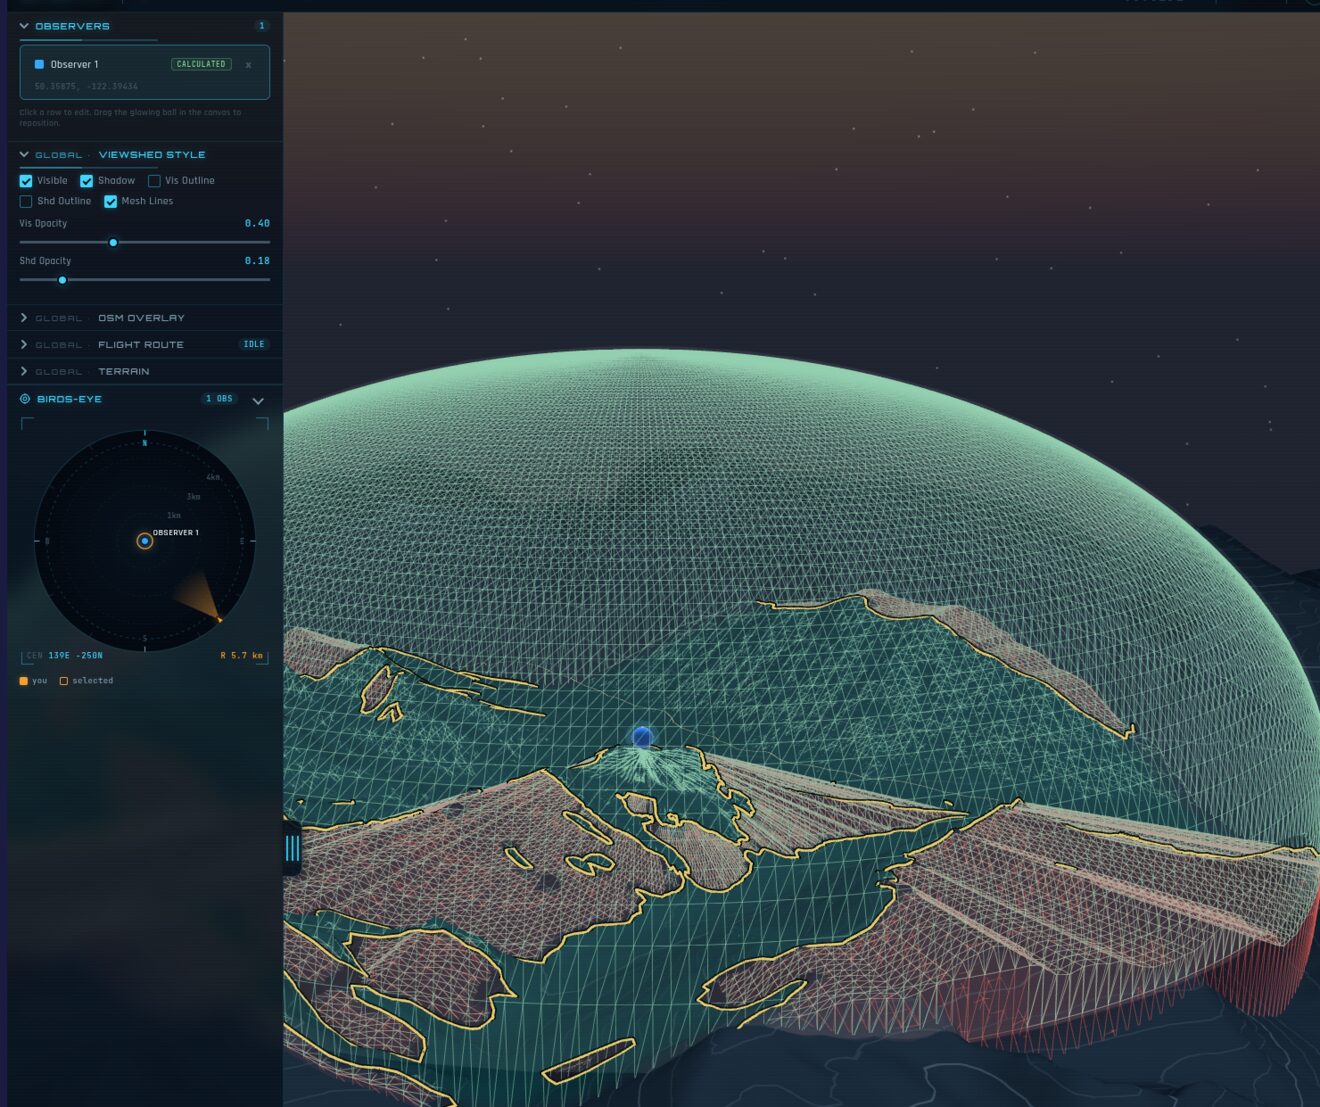
The full workspace. The left panel toggles layers and viewshed style; the birds-eye radar scope plots each observer and the camera’s heading; and here the Mesh Lines toggle draws the lattice the viewshed is built on. An optional OpenStreetMap layer can drape roads and labels over the terrain.
Painting what you can see
Early versions of Skywatch filled the air with the viewshed — a translucent solid you looked through. It was striking, but it could be hard to read: stacked translucent surfaces muddy quickly, and the moment you flew inside the volume you lost the plot entirely. So the default view evolved. Instead of filling the sky, Skywatch now paints the ground: every patch of terrain is tinted by whether the observer can see it, and a single smooth amber line traces the exact edge between seen and unseen. The full volumetric solid is still one toggle away — but for actually reading a viewshed, paint on the land wins.
You can also isolate either half — just the visible ground, or just the shadows — to study one question at a time.
Visible only: the ground the observer commands.
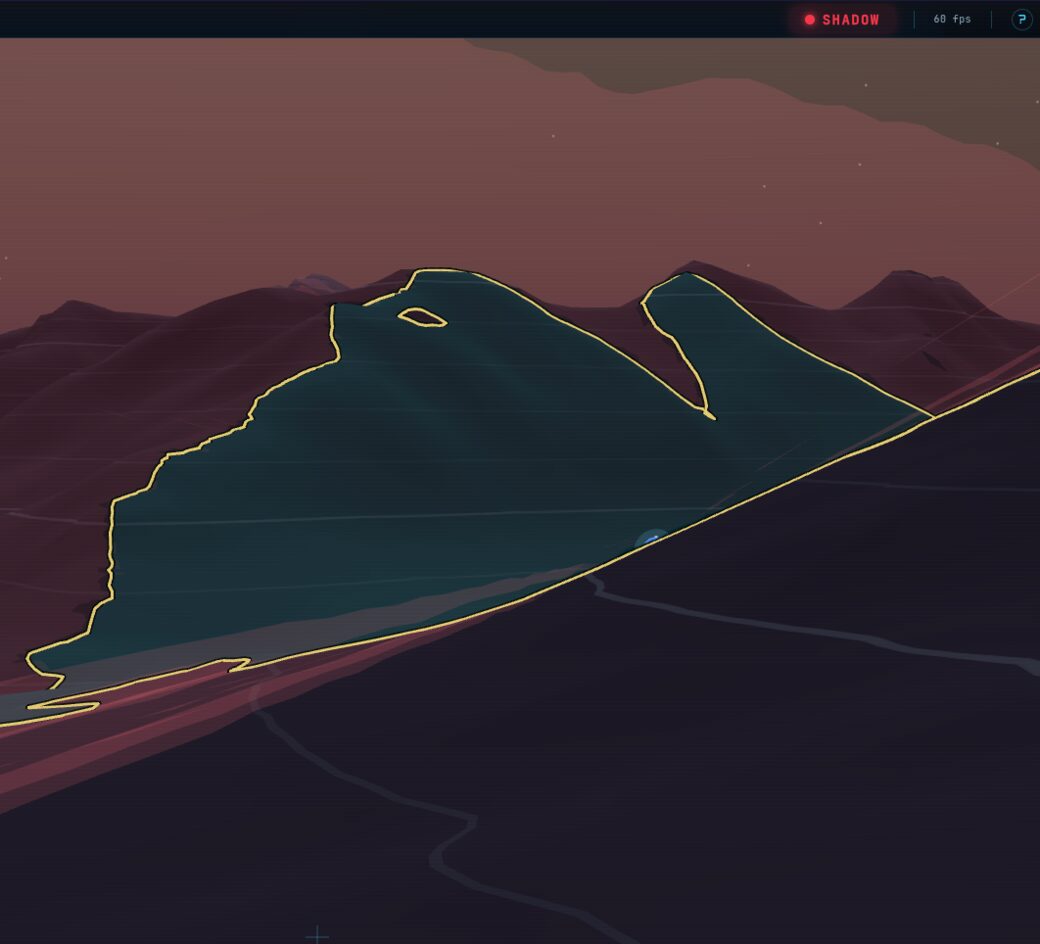
Shadow only: the same scene flipped to what’s hidden.
One Rust core, two front ends
The interesting constraint is that the same analysis has to run in two very different places: as a batch job on a workstation, and live inside a browser tab. The way I keep those honest is a single source of truth — a Rust crate that holds every line of the viewshed maths and compiles two ways:
- a native command-line tool for batch runs, which writes out GeoJSON polygons and GLB 3D meshes; and
- a WebAssembly module — the exact same Rust, compiled to WASM — that the browser app drives from a pool of Web Workers.
Because both targets are built from one codebase, there's no risk of the browser and the CLI quietly disagreeing about what's visible. In the browser, the workers fan out across the compass — each worker owns a slice of the 360° around the observer — so the calculation spreads across all your CPU cores. The native side uses a lock-free shared tile cache and scales close to linearly out to eight workers.
skywatch calculate \
    --cog terrain.tif \
    --longitude=-122.3963 --latitude=50.3610 \
    --height=100 --radius=5000 --workers=4 \
    --volumetric --z-step=5 \
    --output=viewshed.geojson \
    --output-3d=viewshed.glb
Why a mesh, not a polygon
That paint has to come from somewhere. Most viewshed tools hand you a flat outline; Skywatch builds a watertight 3D solid — the actual volume of space the observer commands — and derives everything else, the ground tint and the boundary line included, from it. To make that solid clean, the geometry isn't laid out on the usual square grid. It's built on a polar lattice: rings of samples marching outward along rays of azimuth. You can see that structure directly in the mesh — the radial ribbing below is the lattice, and the Mesh Lines toggle draws it straight onto the terrain.
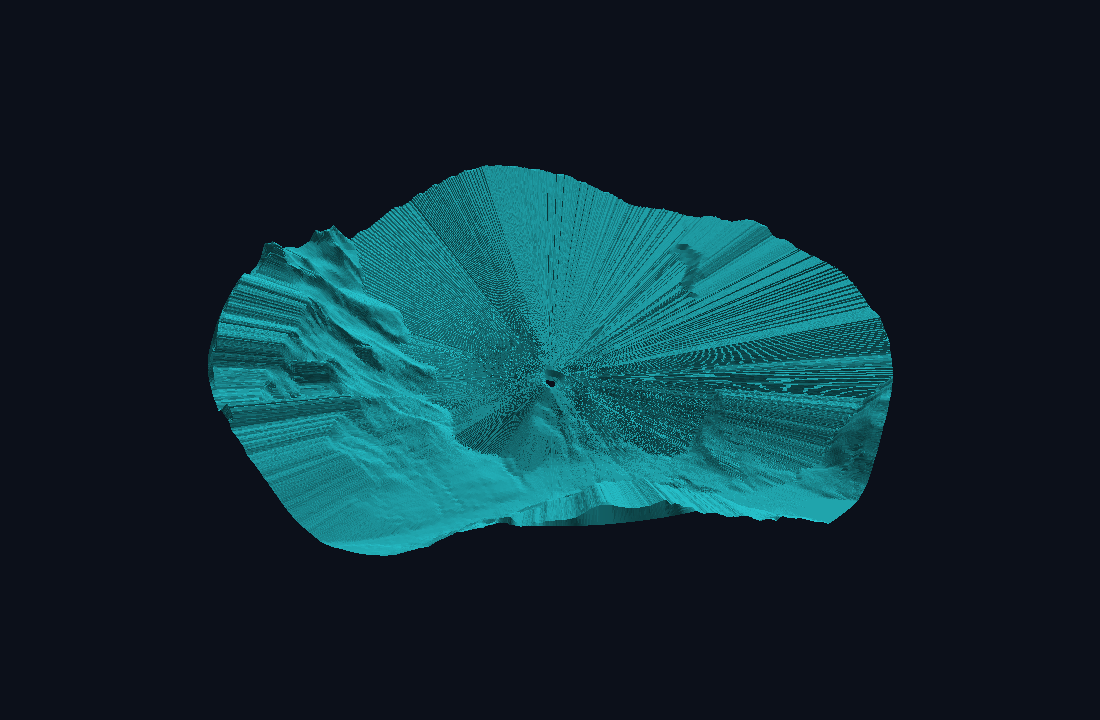
The viewshed volume, oblique view.
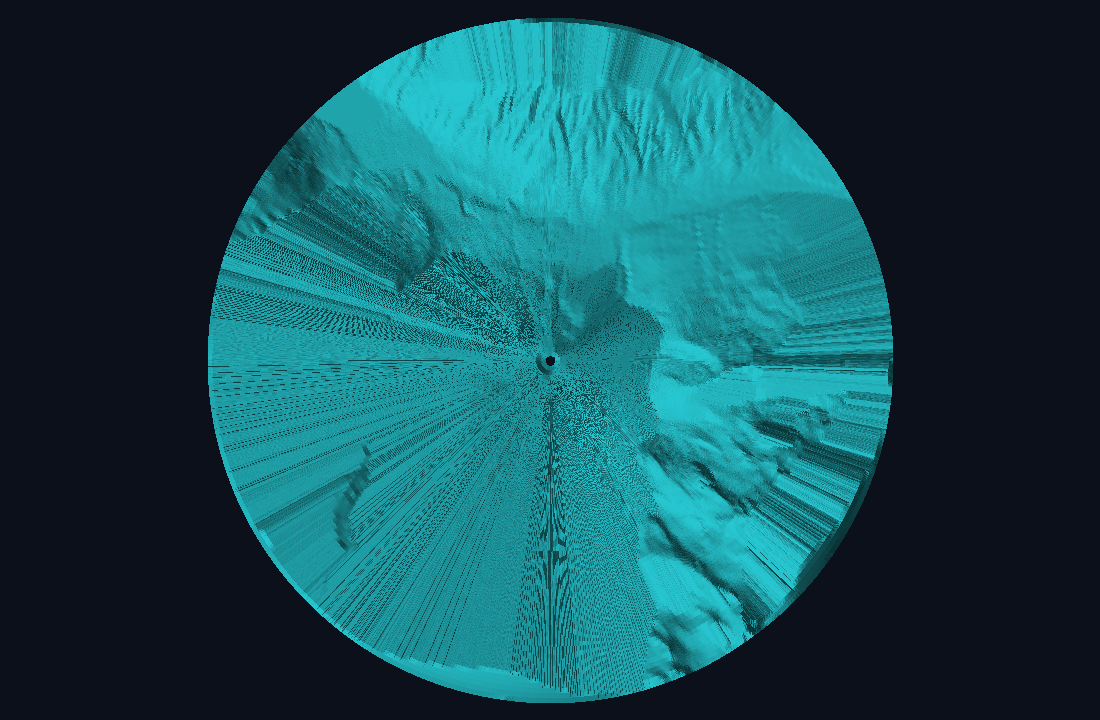
The same volume from above — rings and spokes of the polar lattice.
Underneath, the volume is genuine geometry: a visible shell stitched to a set of shadow surfaces that drop down to meet the terrain wherever a ridge cuts off the view. Rendering two interlocking translucent surfaces is a recipe for flicker (the dreaded z-fighting, where two coincident faces argue over which is in front). Rather than paper over it, the visible and hidden regions are closed against a shared boundary with deliberately opposed surface normals, so the flicker can't arise by construction. A curvature-aware pass then thins out triangles where the surface is already smooth, keeping the mesh light without losing the sharp edges.
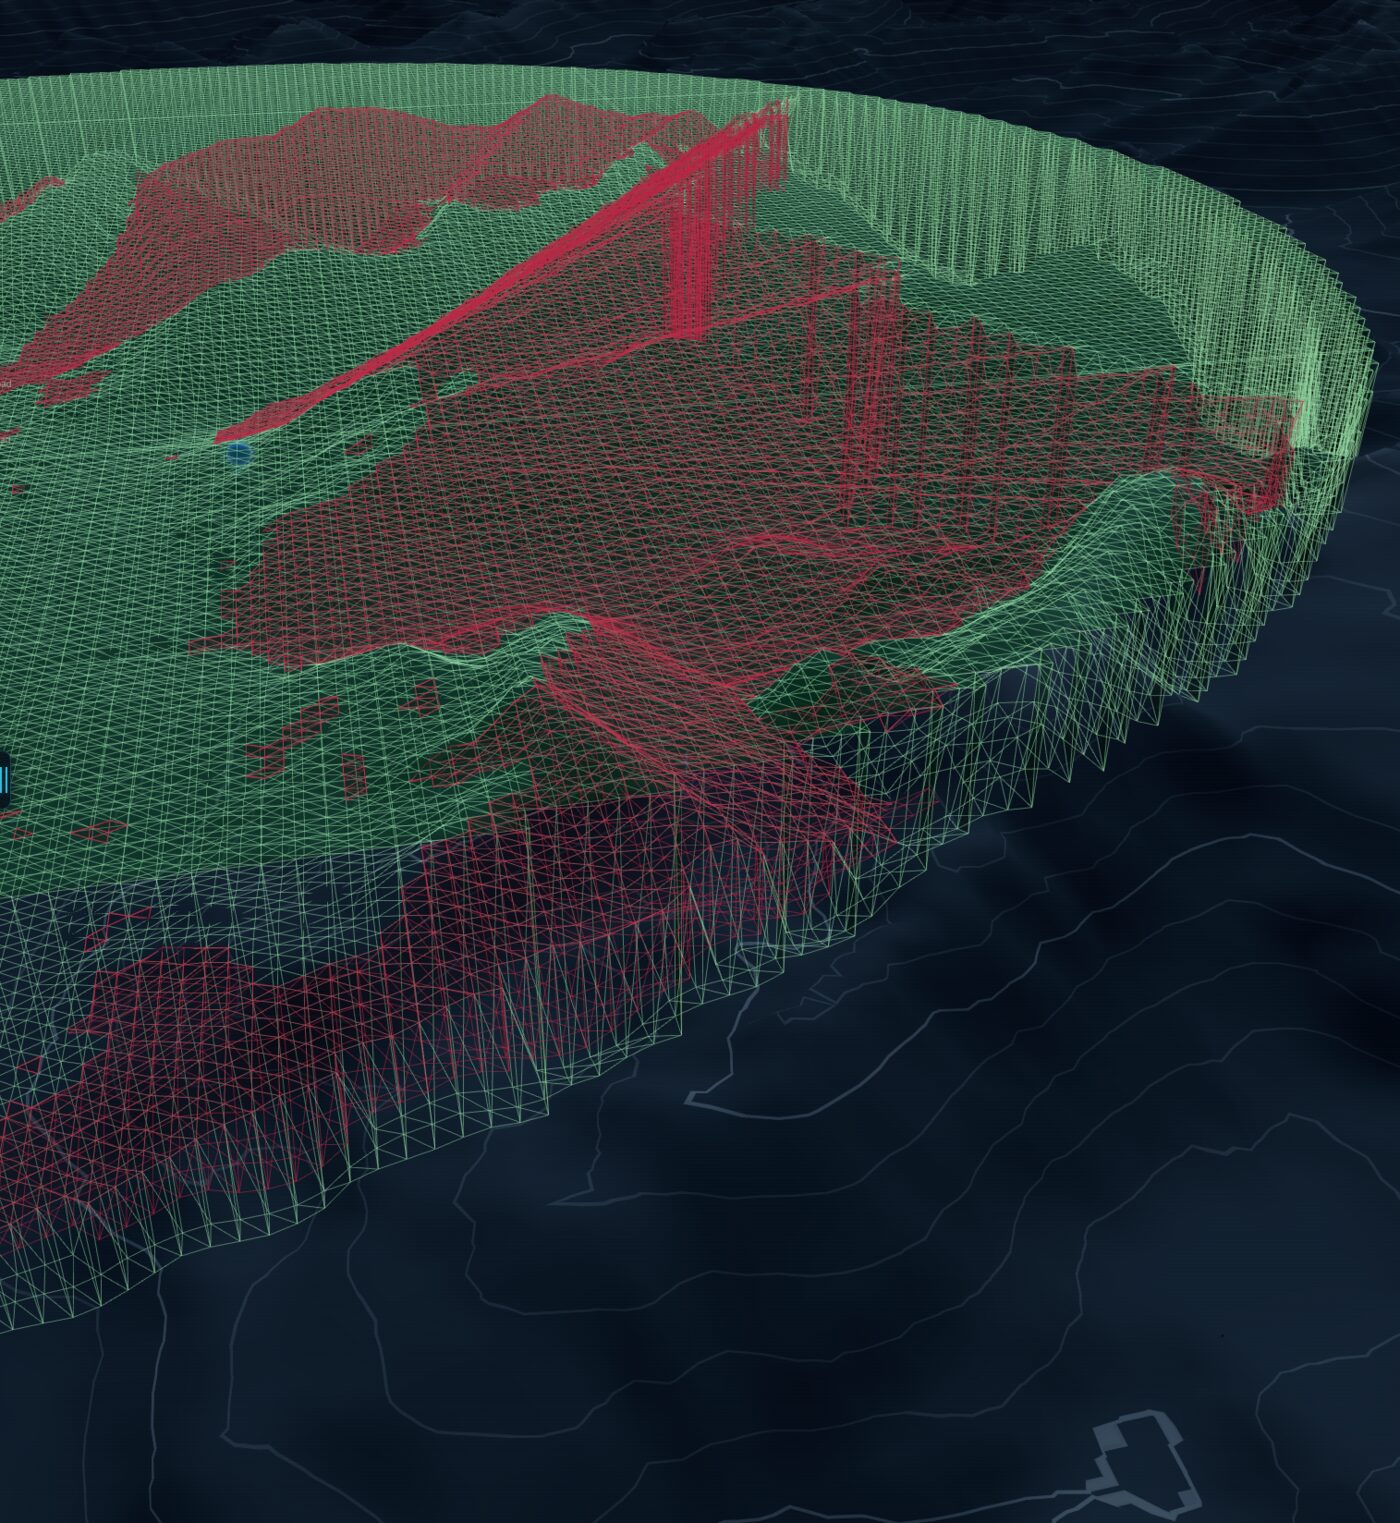
Wireframe of the volume: the visible shell (green) and the shadow surfaces (red) that fall to the terrain behind each ridge.
Getting this right took a long run of iterations — a lot of the project's history is just mesh topology, captured in a running design-of-record so each version had to earn its place against the last. The most recent piece is inside-the-dome legibility: when you fly into the volume, a terrain-following rim line, a perimeter curtain, and a softly shaded interior still tell you exactly where your visibility ends.
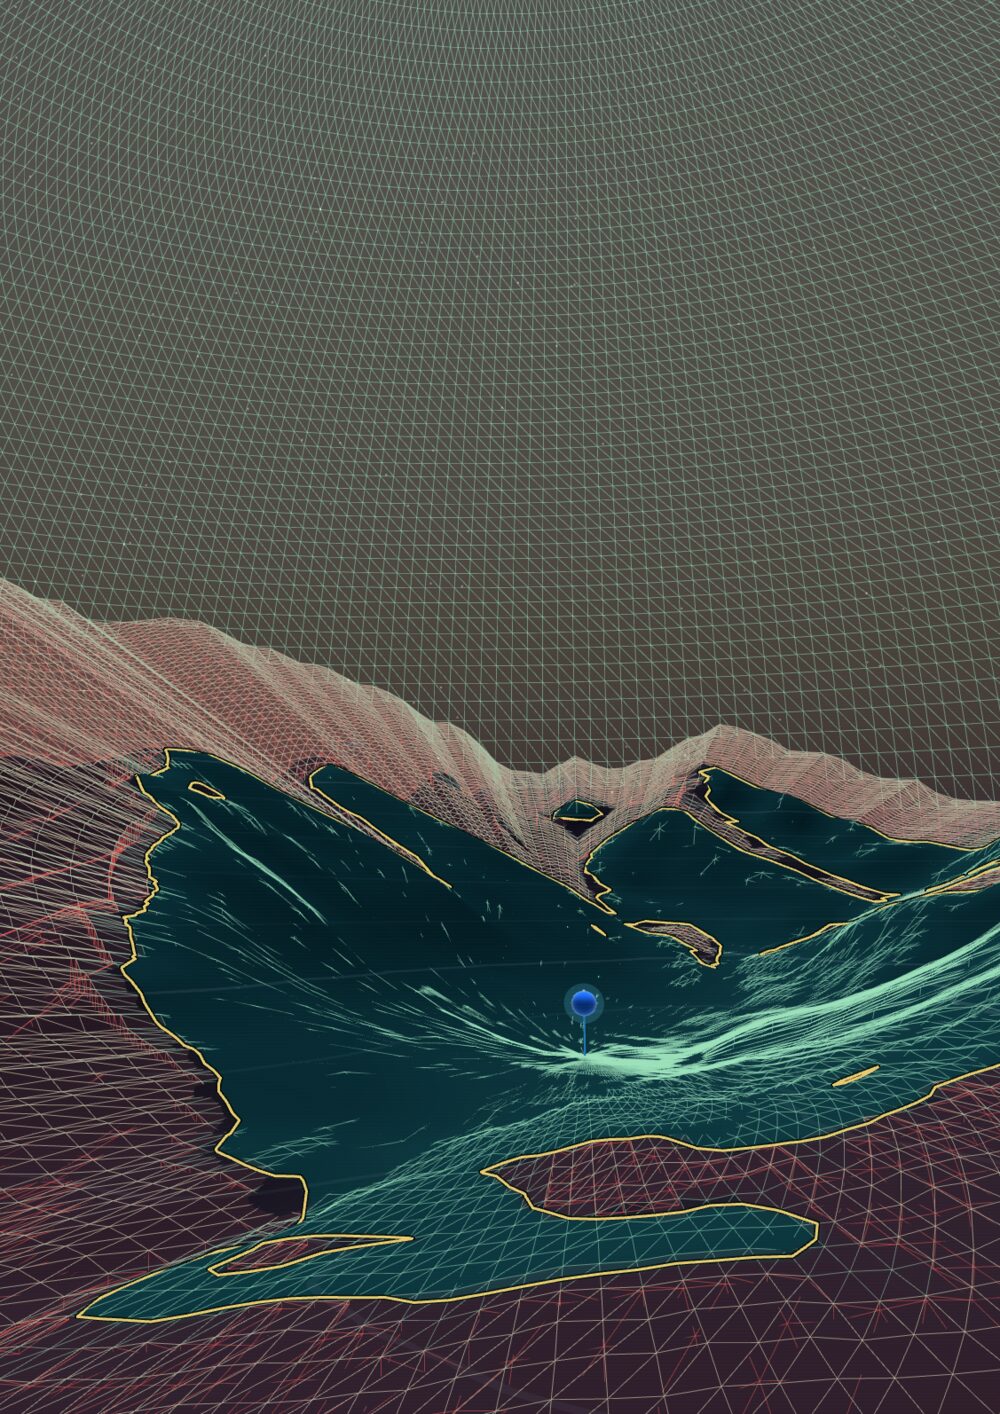
Flown in close with the lattice drawn on: even from inside the volume, the painted ground and the rim keep it clear where visibility ends.
Where the time actually goes
It's tempting to assume the expensive part is building all that geometry. Profiling said otherwise: the cost is dominated — roughly two-thirds to three-quarters of it — by the ray-marching, the act of walking outward from the observer and testing the horizon, cell after cell. Building the mesh is comparatively cheap. That single measurement is what justified the whole architecture: parallelise the marching across workers and cores, and the rest takes care of itself. It's the recurring lesson of performance work — measure before you optimise, because the bottleneck is rarely where your gut puts it.
The data path
A few more pieces make the browser side practical:
| Concern | Approach |
|---|---|
| Elevation data | Cloud-Optimized GeoTIFF (COG), read with HTTP range requests — only the needed bytes, no full download |
| Decoding | A pure-Rust TIFF/COG reader — no GDAL dependency at run time |
| Terrain in the browser | terrain-RGB PNG tiles, cached in IndexedDB (~quarter-second warm load) |
| Map context | OpenStreetMap buildings, roads & labels streamed as FlatGeobuf |
| Compute | Rust → WebAssembly, fanned out over Web Workers (one per azimuth sector) |
| Rendering | Three.js, with 6-DOF camera and an optional 3D mouse |
Writing a GeoTIFF reader in Rust rather than leaning on GDAL sounds like extra work, and it was — but it's what lets the same decoder run unchanged in a browser tab, where GDAL simply can't go.
Where it's going
Skywatch has started to grow from a viewer into a planning tool. You can already drop several observers at once and read their viewsheds against each other — the groundwork for siting questions like where to place a tower, a sensor, a viewpoint, or a trail so it sees what it needs to and stays unobtrusive where it shouldn't. The next thread, which deserves a write-up of its own, turns visibility into movement: planning a route through the terrain that stays hidden — or stays seen — and flying a drone's-eye view along it. The core stays the same; it's the questions you ask of it that grow, from what can I see from here? toward a full observation-planning workspace.
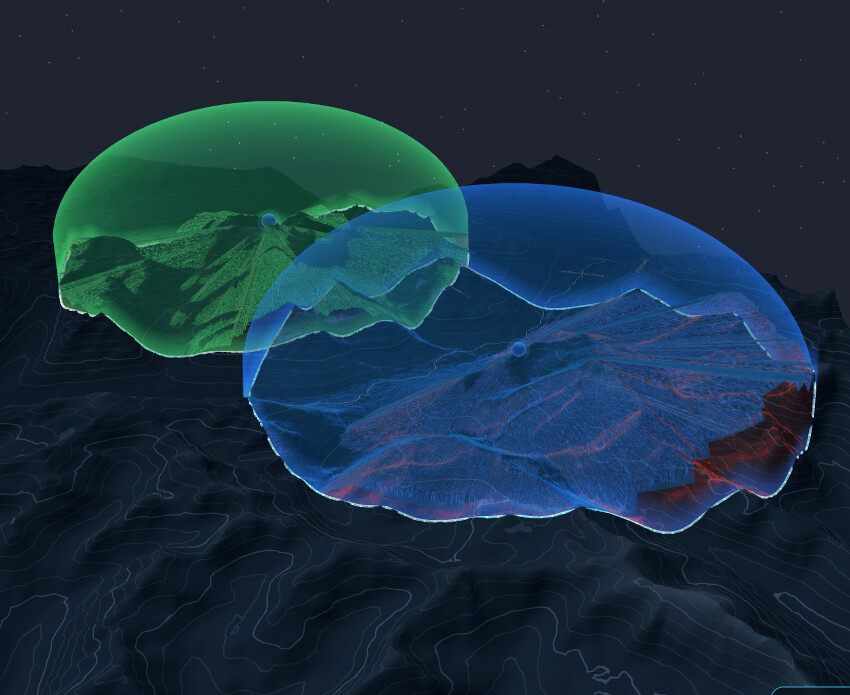
Two observers on one terrain, each with its own viewshed — the basis for comparing coverage, and for planning around it.
Try it
Skywatch runs entirely in your browser — there's a live demo (also linked from the Little Earth homepage). Drag the glowing marker, hit Calc, and fly around the result. A recent desktop or laptop and a WebGL-capable browser will give you the smoothest ride.
It's been a genuinely fun corner of the spatial-programming world to push on: equal parts computational geometry, parallel systems, and getting a browser to do real numerical work. The buildless ethos of this very site and the squeeze-every-cycle ethos of a Rust + WASM compute engine are two sides of the same coin — keep the moving parts few, and make the ones you keep count.